How agents become positive for COVID-19?
In this document, we will consider the dynamics of how agents become positive for COVID-19 in our model.
Before that, a foreword:
The coronavirus pandemic from 2020 to 2023 made almost everyone globally realise the importance of understanding contagion processes. This led to a surge in modelling work highlighting contagion mechanisms. Comma, however, does not focus on this aspect; rather it addresses the mental health consequences of testing positive for COVID-19.
This was a deliberate decision. We believe that there’s ample information out there that shows how COVID-19 spreads, and we aren’t keen to further explore this topic. More crucially, we can exploit public data for the Netherlands made available a posteriori and select specific time points, fully aware of the stage of the COVID-19 virus’s spread at those moments.
Some caveats to bear in mind:
1 - The statistics reflect only the recorded cases resulting from COVID-19 tests (any tests). A dip in testing numbers doesn’t necessarily indicate diminished contagion. Nonetheless, this is the metric according to which governments decided the type of lockdown to put in place. Since lockdowns – operationalised as restrictions on actions – are our independent variable, we prefer to focus on this metric only to measure the impact of a positive COVID-19 test on mental health.
2 - A positive test implies that the only action available to the infected agent is ‘stay_at_home’, coherently with the isolation policy imposed by the Netherlands.
3 - We do not model fatalities, i.e., all agents that get infected successfully recover.
With that said, below we delve into how we measure and apply positivity to COVID-19 in the model.
Step 1: Compute new COVID-19 positive cases in the population
We use the cumulative number of positive tests released in the RIVM dashboard. We select a period of time and a location and we compute the number of new cases in the simulated population as:
where \(N\) is te size of the real population for that specific location, \(M\) is the size of the simulated population, \(n\) is the number of new positives reported on RIVM. Selection is done randomly.
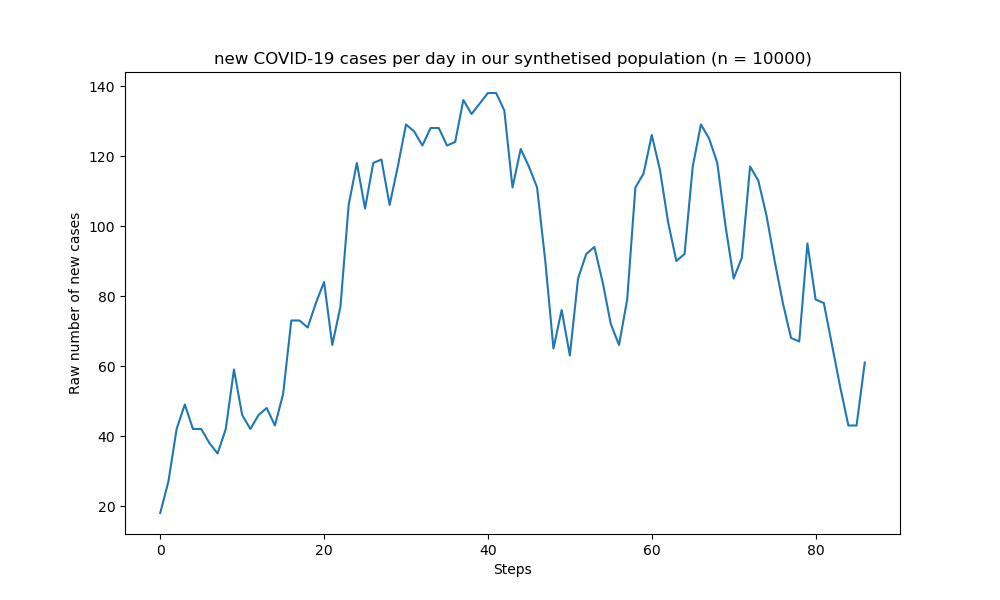
In the image below, we have selected 90 days from ‘2022-01-01’ to ‘2022-03-30’ in Groningen. We have simulated a population of 10000 individuals and we plotted how many people per day become positive, and conversely, how many stay negative.
[ ]
]
Step 2: Set the actions that are available to agents when positive
Once infected, agents have no choice but to stay at home, regardless of the lockdown. Only when agents return negative (in step 3) they are allowed to choose from a different set of actions, depending on the lockdown.
Step 3: Set how long agents will be infectious / definition of recovery
Agents flagged as positive will remain positive for a number of days that is variable. The minimum duration is hard coded in the model as 10 days and the maximum depends on a gamma distribution that peaks ~ 10 days and is determined by the parameters: \(a=5\) and \(scale=3\). The choice for this distribution is based on literature.
In addition, around 20% of the infected population will stay positive for longer than 35 days. This is to simulate a Long COVID type of situation. For this subset of the population, we apply a different gamma distribution with \(a=9\) and \(scale=\frac{70}{a-1}\). This ensures that the distribution peaks at around 70 days, with the inflection point (i.e., the earliest day to turn negative) around 35 days.
[ ]
]
Step 4: Recovery
At the end of their positivity period, agents covid status is flagged to negative, this means that the agent has recovered from covid. Note that whenever their status is set to Negative, agents can be potentially re-infected.